
Line Manager Dashboard - User Guide
Overview
The Line Manager Dashboard in Cognexo provides a comprehensive view of your team's learning performance, engagement, and progress. This dashboard enables you to monitor, support, and coach your direct reports effectively through detailed performance metrics and management tools.
Dashboard Layout
Main Dashboard View
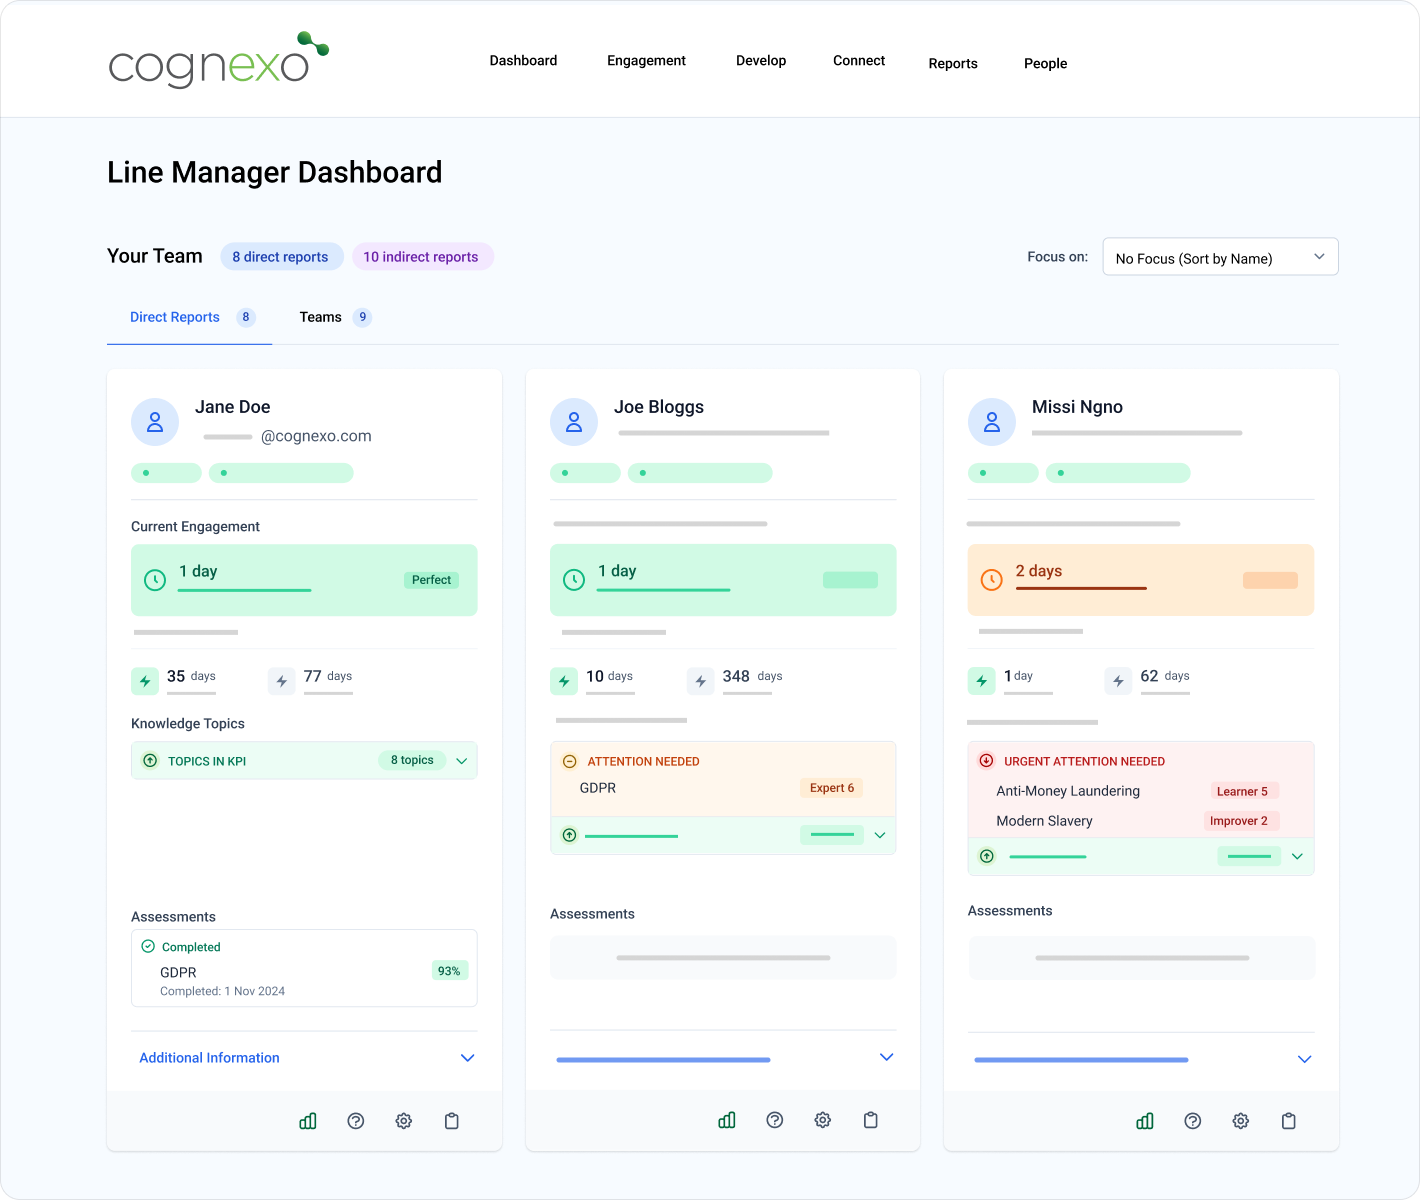
When you log into the Line Manager Dashboard, you'll see:
- Team Overview: Display of all your direct reports
- Summary Statistics: Total count of direct reports and indirect reports at the top of the page
- Individual User Tiles: Each team member is represented by a detailed tile containing their performance data
Filtering and Focus Options
Use the filtering options to focus on specific metrics:
- Engagement: View team members' engagement levels
- Learners Below KPI: Identify users who need immediate attention
- Lowest Ranks: See learners with the lowest performance rankings
- Holiday Status: View users currently on holiday
User Tile Information
Core Performance Data
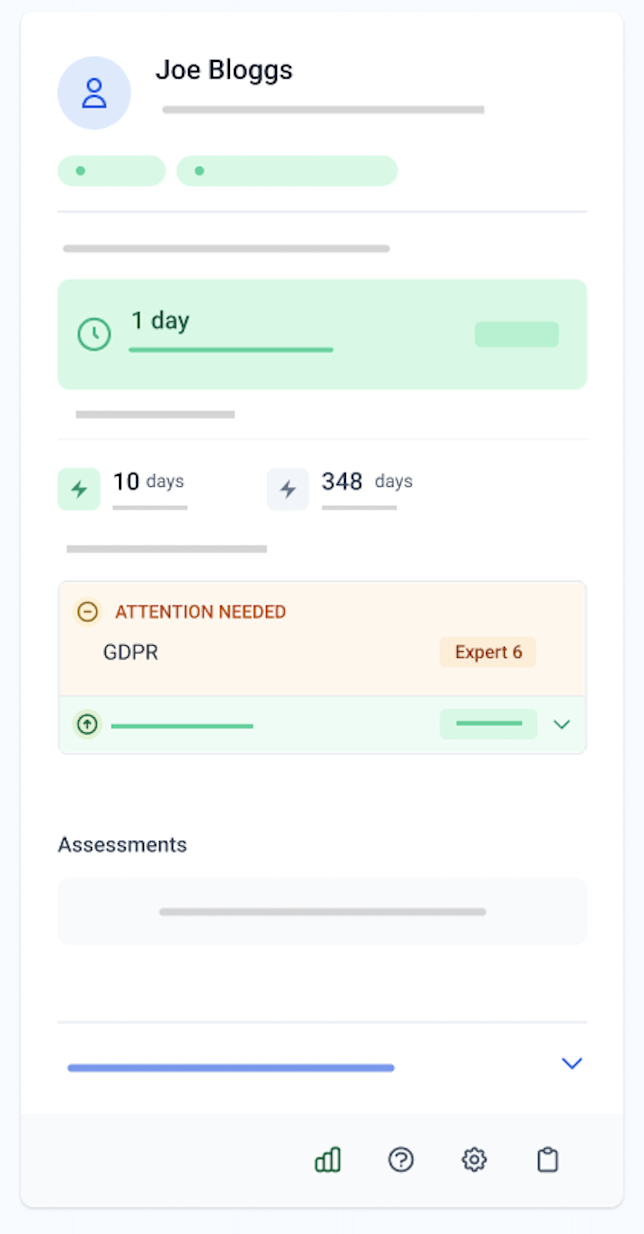
Each user tile displays:
- Current Engagement: Real-time engagement status
- Streaks: Current streak and previous best streak performance
- Knowledge Topics: Current enrolled topics and rankings within each
- Assessments: Participation and results in assessments
- User Details: Department information and activity status
RAG Rating System
The dashboard uses a traffic light system to prioritize attention:
- Red (Urgent): Immediate attention required
- New starters who need content support
- Legacy users struggling with content
- Your highest priority for coaching and support
- Amber (Attention Needed): Moderate priority
- Users near KPI thresholds
- May need additional support to meet targets
- Green (On Track): Performing within KPI
- Opportunities to recognise excellent performance
- Users meeting or exceeding expectations
Tile Navigation Tabs
1. Performance Tab (Default View)
- Shows all knowledge topics and their RAG status
- Provides overview of user's learning performance
- Displays engagement and streak information
2. Question History Tab
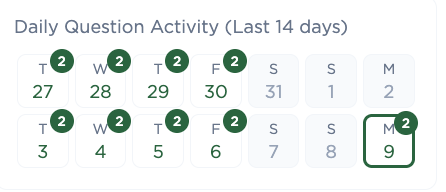
- Two-week Summary: Recent question-answering activity
- Daily Activity: Questions answered per day
- Streak Information: When streaks were lost (if applicable)
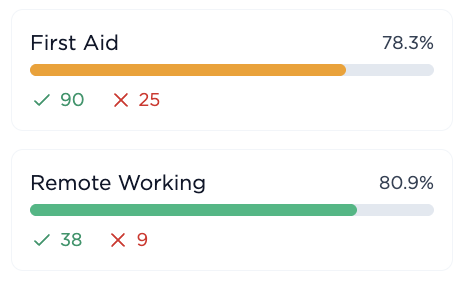
- Topic Listing: All enrolled topics ranked by worst performance first
- Performance Metrics: Percentage of correct/incorrect answers and total questions delivered
Detailed Question History
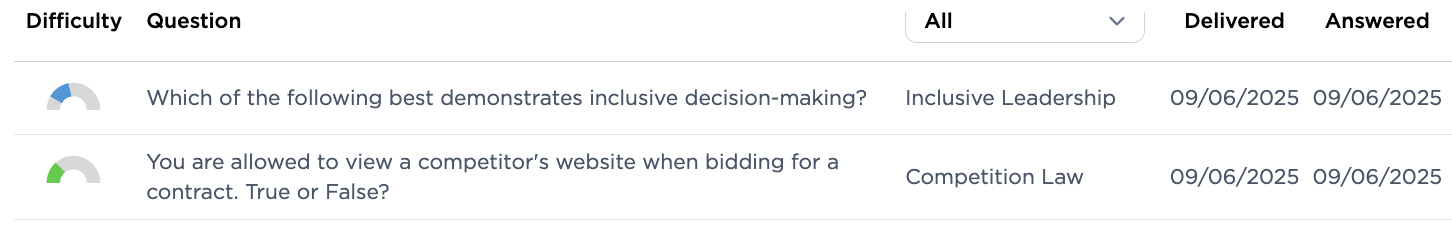
- Click "Show Detailed Question History" to expand the view
- See every question delivered to the user including:
- Topic and delivery date
- Answer date and timezone
- Correct/incorrect status
- Question difficulty level at time of delivery
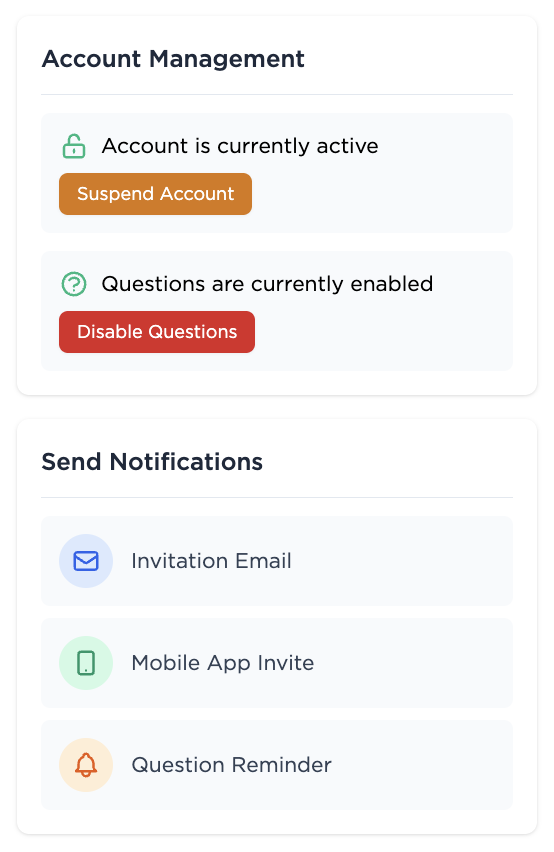
3. User Management Tab
- Account Status: View if account is active
- Account Controls: Suspend or disable user accounts
- Question Management: Suspend or disable questions for specific users
- Notifications: Send various notifications including:
- Invitation reminders
- Mobile app invites
- Question reminders
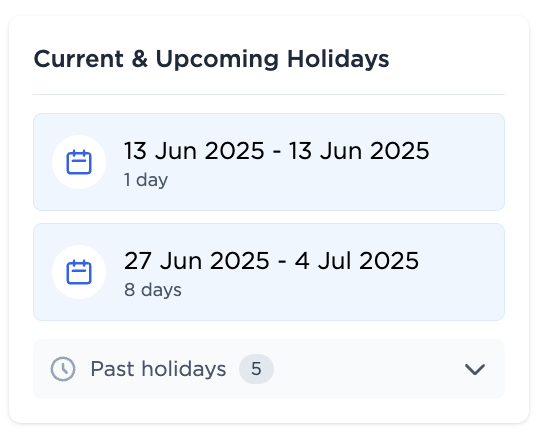
4. Holidays and Audit Tab
- Holiday Management: View current, upcoming, and past holidays
- Audit Trail: Access complete account change history including:
- Bank holidays
- Line manager changes
- Department changes
- Role changes
- Before and after snapshots of all changes
- Engagement Reminders: Track system-generated engagement prompts and emails sent to users
Quick Actions
Communication Features
- User Profile Access: Click the user's name to navigate to their full profile
- Email Integration: Click the email address to open your organization's email client for quick communication
- Tile Expansion: Use the expand button to enlarge tiles for detailed work
Team View
Team Tab Navigation
Access the Team tab next to your Direct Reports to view:
- Team Overview: Summary of the selected team's performance
- Group Filtering: Use the "Group By" filter to organize data by:
- Departments
- Other active system filters
Team Performance Metrics
- Registration Data: Team enrolment statistics
- Engagement Data: Overall team engagement levels
- Assessment Data: Team assessment participation and results
- Knowledge Level KPI Data: Team performance against key performance indicators
Team Details View
- Click "View Team Details" to see the exact dashboard view that team members see
- Useful for understanding the team member perspective
- Helps with coaching conversations and support planning
Administrative Features
Line Manager Simulation (Admin Only)
If you have admin privileges in Cognexo:
- Use the top selection dropdown to simulate being any other line manager
- Select any line manager's email address to view their dashboard perspective
- Useful for troubleshooting, training, and system administration